

I don’t know about you, but when I first started my blog, I would check my “stats” about 20 times a day. It was exciting to see that my traffic was increasing (even if only a teeny bit) or that *gasp* someone was on my site RIGHT THAT VERY MOMENT.
I even got caught up in looking at my number of social media followers on a daily basis, as if my worth as a newbie blogger and business owner could be measured by how many people had liked my Facebook page in the last 24 hours.
Now, I know better.
And it’s not that you should completely give up on tracking your statistics, but it’s that you should focus more on tracking the things that matter so that you don’t waste time tracking metrics that are getting you nowhere.
So which stats DO matter? And what should you focus on in order to grow your blog and business? In this post, I’ll be sharing five different metrics that you should pay attention to, as well as the spreadsheets I use to keep track of them all! Let’s dive in.
By the way, if you’d prefer to listen to this episode, rather than read it, you can listen via the audio player below. Yay for options!
First of all, which metrics should you distance yourself from?
Well, the two I mentioned above: your pageviews and social media followers. Don’t get me wrong, you’ll want to have some idea of where you’re at in this realm, but I do not recommend obsessively checking your Google Analytics account each day or refreshing your Instagram to see if anyone new joined your crew.
Why?
Because constantly eyeing your “vanity metrics” is not going to help you grow your audience or income. Rather than simply seeing how many new followers you have, it’s your job to figure out why those new people followed you or how to convert more people to follow, engage with, or buy from you.
So, at the end of the day, you should look for patterns and conversion rates in your metrics, which will help you write better content, make more money, and understand what to focus on and what to ditch. Boo-yah!
But if tracking your pageviews and number of followers isn’t the right way to go, what is? Which metrics SHOULD you pay attention to? Let’s talk.
1. Webinar sales conversion rate
If webinars are part of your sales strategy, then obviously you’ll want to track data that lets you know whether or not your webinars are actually profitable, and to what extent.
Webinar conversion rates help you to figure that out. Here’s the formula:
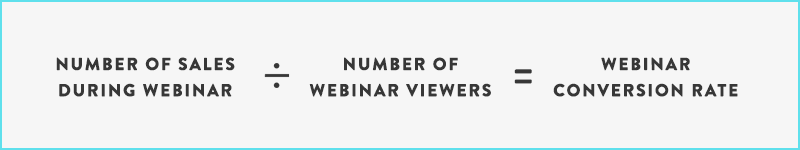
So, if 500 people watched your webinar and 61 people purchased your product, that would be a 12.2% conversion rate. From what I’ve seen, webinar conversion rates typically hover between 5-20% overall.
Knowing your webinar conversion rate can help you to decide a few things:
- Which webinars may need improvement (because they have a low conversion rate). Think of how you can make them more valuable or improve your pitch in order to get more sales.
- Which webinars convert at a high rate. Knowing this can be crazy important, especially if you want to work with affiliates in the future or plan to have an evergreen webinar funnel. If you’re doing either of those things, then you’ll obviously want to use your most highly converting webinar, which will result in more sales.
- You’ll also be able to see how different topics affect your conversion rate, which can help you plan out new content in the future (for your webinars, email sequences, blog posts, etc).
In order to accurately calculate your conversion rate, you’ll want to use some sort of webinar software that actually tracks your statistics, like WebinarJam. WebinarJam lets you know how many live attendees you had, how many watched the replay, and even how many sales you had from your webinar.
It also provides a number of other cool stats, like which part of the webinar people tended to leave during (giving you the opportunity to spice that section up for future webinars in order to increase your retention rate).
Cool, right?
Want to get five spreadsheets you can use to track all of the metrics and formulas in this post? Click the button below to get ’em all instantly.

2. Blog post shares and comments
Rather than simply tracking your traffic, I recommend tracking the engagement that that traffic brings you. Tracking engagement often comes in the form of seeing how many shares and comments each of your blog posts has received.
How can this info be helpful to you?
Because if you notice that blog post ABC has 22 combined shares and comments, while blog post XYZ has 673, then you can probably reason that topic XYZ is something your readers are more interested in. Or at the very least, that there is something about that post or topic that reeled people in (The title? The photos? The formatting of your text?).
Like I mentioned at the beginning of this post, part of your job when tracking your metrics is to find patterns in your statistics. If you notice that certain topics consistently have more interaction and that people are sharing them more often, then this is a good indication that you should create more content like that, repurpose that content onto other platforms, and perhaps even create an e-course about it.
Tracking comments is easy, but how do you track shares of each blog post on social media? I personally recommend a WordPress plugin called Social Warfare. You can actually see Social Warfare in action on my own site, too. It includes social sharing buttons, but also displays the number of times each particular post has been shared on the web.
If you wanted to get fancy with this, I’d recommend creating a spreadsheet with three columns: the name of your post, the number of shares, and the number of comments. That will make it easy for you to go back and see how your engagement is lookin’ and will likely breed new content ideas for you!
Of course, you’ll probably want to go back each quarter and update your engagement stats inside your spreadsheet, since your numbers will fluctuate over time.
3. Subscriber Value
This one is pretty simple. You want to calculate how much money you earn from each of your email subscribers, on average. Some people do this on a yearly basis, but in my opinion, online businesses grow and change very quickly, so it makes more sense to do this on a monthly basis.
Here’s how to do it:
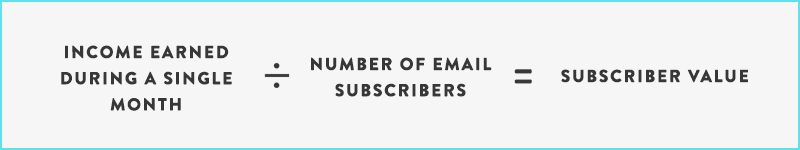
So if you made $6,000 in a month and you had 2,000 email subscribers, that would be $3 per subscriber, on average.
This number can be important for two specific reasons:
- You’ll have a general idea of how many more subscribers you’d need in order to hit your income goals (so long as your subscriber value remains roughly consistent).
- You’ll know how much you can spend to acquire new subscribers.
Let’s talk about #2.
A lot of people use Facebook ads to grow their email lists. When you spend money on ads, you’ll want to know how much it costs to get a new subscriber (which Facebook tells you). This is called “Cost Per Lead” and usually costs $1-5 for each new lead/subscriber.
So, if you know that your subscriber value is $3, then you can logically reason that you could spend up to about $2.50 per subscriber in order to still make a profit.
This can help you grow your list and profitability, fast. Because if you’re spending $1,000 on Facebook ads per month (which might sound like a lot!), and it costs $2.50 per lead, then you’d add 400 new subscribers to your email list each month.
And if each subscriber is worth $3, on average, then 400 x $3 = $1,200. Basically, you’d make a $200 profit on your $1,000 spend on ads. $200 isn’t a lot, but you can imagine how much bigger that number would be if you:
- Spent more on Facebook ads.
- Increased your conversion rates so that your Subscriber Value increased.
- Lowered the Cost Per Lead by using better ads targeting.
With enough testing and number-crunching, you could be on your way to a very profitable business. Ya feel me?
If you want your hands on five spreadsheets that will help you keep track of your Subscriber Value, as well as all the other metrics in this post, then just click the button below to grab them (fo’ free)!
4. Average growth per month
Okay, okay. So, I know that I mentioned earlier that you shouldn’t pay attention to your pageviews or number of followers. And while I still mostly believe that, I do think it’s beneficial to track your monthly growth (rather than checking every 7.2 hours).
I keep a spreadsheet, that I update on the 1st of each month, which lists things like how many followers I have on social media, how much my income was for the previous month, and how big my email list is.
Doing this on the 1st of every month gives me the chance to compare my growth to previous months. Again, focus on the patterns. After doing this for a few months, you should start to notice that your email list grows by X number of followers or by X% every month.
If you know your subscriber value, that can actually be very helpful in predicting your revenue for upcoming months, since you’ll be able to predict how much your email list will grow and how much money you’ll make from each subscriber.
Also, you can use your monthly growth to figure out why some of your numbers increased more than usual. Perhaps you started a Twitter chat, which grew your Twitter account more quickly. Or maybe you launched a free email course, which doubled your email list from the previous month.
Whatever it is, keeping track of your “vanity metrics” on a monthly basis can actually help you to see patterns so that you can do more of the things that bring you the highest payoff as well as predict future growth and income. BOOM.
5. Funnel conversion rates
Do you have any sales funnels to promote your products on autopilot? You should. But in addition to creating evergreen funnels to make continuous sales, you should also be tracking how well each of your funnels performs.
Here’s the formula:
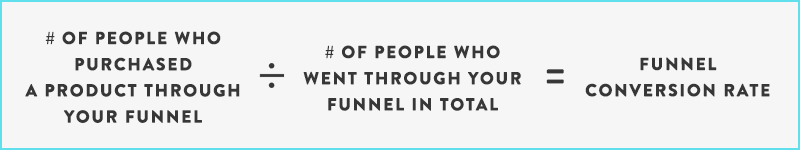
So, how can you use this to make more sales? Well, if you know your funnel conversation rate percentage, then you would know how many people you need in your funnel in order to hit your income goals.
Let’s take an example…
Let’s say that 500 people sign up for your “free cheatsheet” each month. And that cheatsheet is the “top of your funnel,” which means that it is the beginning of your sales funnel. So, the people who sign up for the cheatsheet will automatically be placed into a 2-week email sales funnel sequence where you eventually pitch your product.
If by the end of the sales funnel, 25 of those people purchase the product you pitched, then you know that your funnel has about a 5% conversion rate because…
25 / 500 = 5%
Why is this important? Because let’s say your product is $100. If 25 people went through your funnel and bought it, that would be $2,500. But what if your income goal is $5,000? Well, then you’d know that you need 1,000 people to go through your funnel each month.
Because 5% of 1,000 is 50. And 50 x $100 is $5,000.
See what I mean?
This can also be hugely beneficial if you choose to use ads.
Usually, with Facebook ads, you’d pay between $1-5 for each new lead. So, if you decided to spend $500 on ads, and the Cost Per Lead was $2, then you’d come away with 250 new leads/subscribers. And if 250 people went through the funnel we’ve been talking about (with the 5% conversion rate), then that would mean that 12.5 of those people would end up buying your product (yes, half a person will buy your product 😉 ).
How’d I come to that number?
250 x 0.05 = 12.5
And remember, the product was $100. So…
12.5 x $100 = $1,250.
Meaning you just spend $500…and made $1,250! So that’s a profit of $750 that you otherwise wouldn’t have made! Hollaaaaa!
But if you didn’t know the conversion rate of your sales funnel, then you’d have no idea how much you can afford to pay per lead (and still make a profit) or how much money you can expect to make based on how much you spend on ads.
Nerdy statistics to the rescue, amiright?! 😉
Don’t forget, you can grab all five spreadsheets I use to track these statistics by clicking the button below. They also include automatic formulas, so if you pop in your data, it will calculate your conversion rates without you needing to do any math. #yourewelcome